Introduction to Data Analysis
Data analysis is foundational across industries such as business, healthcare, and research. With the rise of programming languages like Python, analysts now have powerful, accessible tools to extract meaningful insights from complex data. This page offers a hands-on demonstration of how Python can be used for real-world data analysis, including an in-depth case study on fraud and computer misuse in the UK.
Python Libraries for Data Analysis
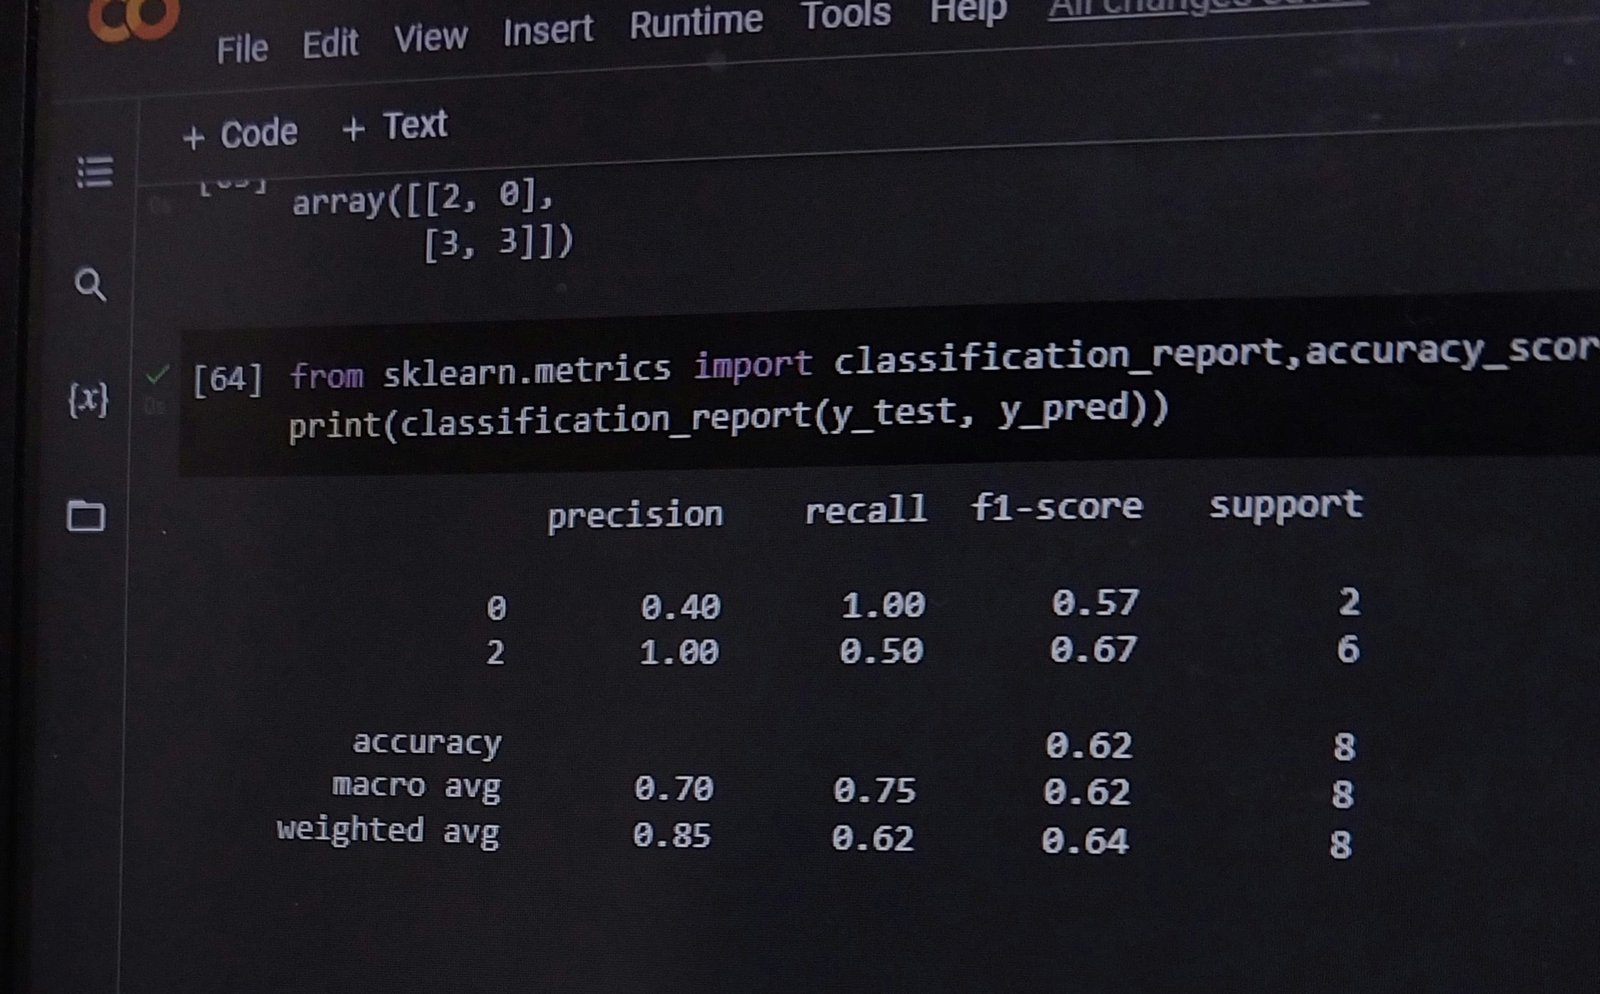
Python boasts a robust ecosystem of libraries designed specifically for data science. Among them:
- Pandas – for high-performance data manipulation and analysis
- NumPy – for numerical computing and array handling
- Matplotlib – for visualising data trends and patterns
Together, these tools form the backbone of many modern data analysis workflows.
Practical Applications of Data Analysis
Data analysis enables professionals to uncover patterns, make predictions, and drive strategic decisions. In business, analysts use Python to monitor KPIs, optimise operations, and predict trends. In healthcare, it helps evaluate patient outcomes and improve diagnostics. And in academic research, Python simplifies the handling of experimental results, accelerating insight generation.
Fraud and Computer Misuse Analysis (CSEW 2024)
This project analyses trends in fraud and computer misuse from 2012 to 2024 using data from the Crime Survey for England and Wales (CSEW). The analysis highlights demographic and geographic risk factors, offering insight into who is most affected and how patterns have shifted over time.
Visual Summary
Click through the carousel below to explore key findings visually. Each chart provides a different lens on fraud and computer misuse trends in the UK.


Key Insights
- Fraud reached a peak in 2019, followed by a modest decline—but levels remain higher than pre-2015.
- Computer misuse is rising again, driven primarily by hacking and unauthorised access in 2023–2024.
- Single-parent households and low-income renters experience disproportionately high levels of fraud victimisation.
Victim Risk Profiles
- Men and Women aged 45-65 and Separated or Divorced experience the highest fraud exposure across demographics.
- Those on higher incomes (£52,000k or more): Have a greater vulnerability to computer misuse offences.
- Urban, low-income households: Frequently impacted by both fraud and cybercrime.
- Bedfordshire tops the UK for fraud and cybercrime rates, with London and Dyfed-Powys not far behind.
Project Summary
- Performed in-depth analysis of UK national crime data using Python (Pandas & NumPy).
- Produced data visualisations with Matplotlib to uncover key trends and outliers.
- Highlighted actionable insights across demographics, geographic locations, and offence types.
- Applied cleaning on real-world data, transformation, python techniques to support evidence-based analysis.
Conclusion
Overall fraud levels appear to have peaked in 2019 and have shown a modest decline in recent years. This may reflect the cumulative impact of increased public awareness campaigns, enhanced bank fraud prevention measures, and broader adoption of multi-factor authentication and digital security protocols.
However, the resurgence of computer misuse in 2023–2024 — particularly hacking and unauthorised access — suggests that cybercrime is evolving, and public policy must keep pace. Continued education and investment in digital literacy are key to protecting vulnerable groups, especially younger internet users and low-income households.
The data supports the idea that crime prevention is effective when targeted and consistent, but also highlights the need for dynamic approaches to emerging digital threats.
Want to Learn More?
Interested in how this was built? Contact me to learn more about the notebook behind the insights or how I can help with your data projects.
Download Data
You can download the dataset used in this analysis directly from the source below:
Download the dataset (XLSX, Crime Survey for England and Wales 2024)